Summary findings from Road Freight data
If we rank them from greatest to least, Great Britain will have the most commodities lifted and transported annually from 2014 to 2019, while Northern Ireland will have the least quantity of goods lifted over the same time period. This explains and supports the Grand Contour Canal idea, which would create a canal through Great Britain but not in the Northern Ireland.
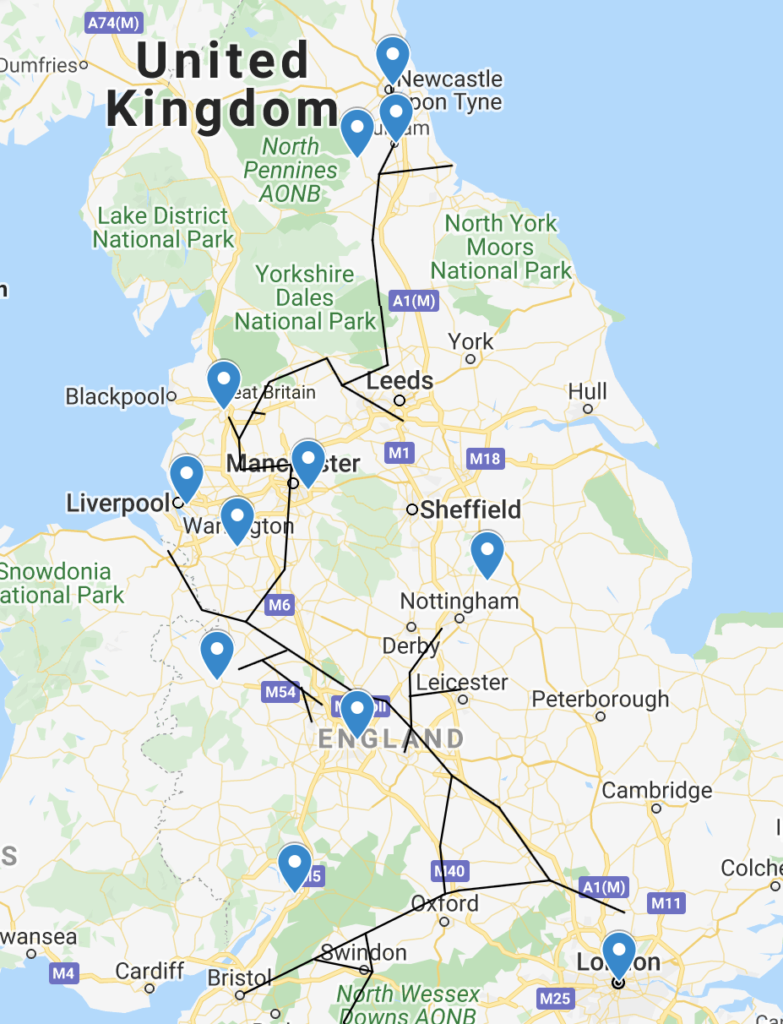
During the period 2014 to 2019, England lifted an average of 1298 million tonnes, making it the top country in the UK in terms of commodities lifted. Whereas Scotland, the second-ranked country, lifted an average of 140.5 million tonnes, Wales carried 73.25 million tonnes, and Northern Ireland only reached 3.25 million tonnes on average. (Table.1) A similar trend emerges when data on commodities lifted by area and country of origin and destination is examined. The most popular location for good incoming and outgoing transportation is in England, Great Britain; yet, several regions in Northern Ireland are not reported due to a limited sample size. (< 1 million tonnes) It’s no surprise that many of the popular regions are near to or overlapped with the projected Canal project when we look at specific regions where the number of goods lifted was recorded in 2019 compared to the Canal project. Take a look at Figure 1. Regions marked with are important transportation center sand near to the canal.
The total amount of goods being carried by trucks on road decreased from 2014 to 2019, according to the data the grand total of goods lifted by NUTS32 typography decreased from 1743.7 to 1439.6 million tonnes. In the urban and intermediate regions, there were fewer commodities loaded and unloaded; however, the tendency switched to the rural region, where there was little change from 56.3 to 60.6 million tonnes of goods loaded and 57 to 62.8 million tonnes of goods discharged being observed.
Table 1.
| England | Scotland | Wales | Northern Ireland | |
| 2004 | 1,483 | 173 | 86 | 2 |
| 2005 | 1,487 | 164 | 94 | 1 |
| 2006 | 1,516 | 169 | 89 | 2 |
| 2007 | 1,548 | 176 | 96 | 3 |
| 2008 | 1,418 | 156 | 89 | 4 |
| 2009 | 1,158 | 131 | 66 | 1 |
| 2010 | 1,283 | 131 | 73 | 2 |
| 2011 | 1,255 | 134 | 64 | 3 |
| 2012 | 1,219 | 136 | 71 | 1 |
| 2013 | 1,128 | 124 | 59 | 6 |
| 2014 | 1,140 | 122 | 59 | 1 |
| 2015 | 1,247 | 131 | 63 | 4 |
| 2016 | 1,226 | 138 | 67 | 3 |
| 2017 | 1,199 | 121 | 70 | 6 |
| 2018 | 1,213 | 127 | 62 | 4 |
| 2019 | 1,253 | 115 | 64 | 9 |
| Average | 1298.3125 | 140.5 | 73.25 | 3.25 |
Figure 1.
Train freight commodities:
- Coal
- Metal ore, steel, iron
- Petroleum, Chemicals
- Industrial minerals
- Parcels and mails
- Other goods that moved in variety of wagons
I have looked at the data colloected during 2014 to 2021presented Percentage of commercial freight trains that arrive at planned destination within 15 minutes of their booked arrival time or with less than 15 minutes of Network Rail or passenger operator delay by Network Rail Region (periodic and moving annual average), Great Britain. With average more than 90 % of freight trains can arrive between location to location within 15 minutes of their planned time. This implies that train freight is still effective and used frequently because of their rule on punctuality.
| Great Britain (2014-2021) FDM-R | Great Britain (2014-2021) FDM-R(MAA) | |
| Average % | 94% | |
| Average % | 93.8% |
However, train Freight had declined for 8.6% in 2020-21 compared with 2019-20. This is mainly because that there was a 17.2% reduction in amount of goods during 2020 when covid-19 first started. Then the second half of the 2021(October 2020 to March 2021) saw an increase of 0.5% compared with the same period in 2019-20. For 2019-20, the same statistics pattern applies to passenger railways as well. Following the government’s announcement of measures to restrict the spread of the Coronavirus pandemic, rail passenger journeys in the United Kingdom fell by 1.1%. The represent somewhat greater drop in rail journey on comparison to the 0.8 percent drop reported in the 2019-20 Q4 Passenger Train Usage statistical release. The most significant decreases in trips in 2019-20 were in Wales and the East of England (both down 3.8 % from 2018-19).
As assessed by the Freight Delivery Metric, the proportion of freight trains arriving within 15 minutes, as measured by the Freight Delivery Metric, hit 95.2 percent in 2020-21, according to statistics. Since this measurement of time series began in 2012-2013, this is the highest level of punctuality ever recorded. Based on the summary website provided, the number of freight train movements in the United Kingdom dropped by 9.6% in 2020-21 compared to the previous year. Due to this decline, the total freight train kilometers al so fell by 9.9% from 2019-20 to 2020-21.
Then I looked at the yearly train safety data, which included accidents involving passengers, employees, and the general public, as well as risky events. These events are reported to the Office of Rail and Road under the Reporting of Injuries, Diseases, and Dangerous Occurrences Regulation (RIDDOR), which covers the mainline network in the United Kingdom, as well as London Underground, Heritage, Light Rail, and Tramways. Some of the key results are that there were 12 passenger deaths in 2019-20: seven on the mainline and five on the London Underground. There is decrease from 17 passenger fatalities in 2018-19 which shows a good sign. In the year of 2019-20, there were four workplace deaths. Three of these happened on the mainline, and one of them resulted in the death of a London Underground infrastructure worker. On the mainline, the number of serious and minor workplace injuries has dropped to its lowest point since the time series began in 2007-08.
Railroad Emission
- In comparison to 2018-19, passenger train electricity use grew by 5.3 percent and diesel usage climbed by 1.5 percent. Passenger kilometers dropped by 1.3 percent during the same time period.
- The Carbon dioxide emissions from passenger trains have decreased to 35.1g CO2e per passenger kilometer as a consequence. This is the lowest level since the corresponding time series began in 2011 to 2012
- The quantity of fuel burned by freight trains grew by 12.5% to 172 million litres in 2019-20. This is the highest level of diesel consumption since 2015-16, and the first time it has climbed year over year since then. The amount of electricity consumed decreased by 6.3 percent to 70 million kWh.
- Carbon dioxide emissions from freight trains have grown to 27.5g Carbon dioxide per tonnes km as a result. Since the similar time series began in 2011-12, this is the highest level yet.
Conclusion
Roadways and railways transport goods and cars to a variety of destinations and assist people in arriving at their destination. The process of transferring products or people from one location to another using roadway or railway is known as road freight and train freight. These modes of transportation continue to be the most widely utilized form of freight distribution worldwide. Even though water transport such as barges can provide an option for long-distance large-scale freight services, road freight will still very likely to continue dominate in the UK. Because public acceptance of air, sea, and rail transportation is growing, it is essential to apply road transportation to get people to their specific location first.